
Rendering Transformations: Dynamic Colormap
In this section we will describe how to setup a dynamic colormap for a layer.
Dynamic colormap definition
A dynamic colormap is a Raster-to-Raster rendering transformation which applies a color ramp to a Raster based on its statistics and an input colormap. This colormap can be defined as a list of colours or by a QuantumGIS SVG file. The operation internally searches for the minimum and maximum raster values and dynamically generates a color ramp which fits the input colormap.
For using the dynamic colormap a few requirements are needed:
a run of the gdalinfo -stats command on the input layer in order to generate a PAM auxiliary file containing statistics and metadata of the layer.
a copy of the resources inside the $QGIS_ROOT/apps/qgis/resources/cpt-city-XXXXX folder within the GEOSERVER_DATA_DIR saved as a styles/ramps subfolder.
configuration of the indexer file for accepting auxiliary files by adding the following XML code in the parameters section:
<parameter name="CheckAuxiliaryMetadata" value="true" />Note
$QGIS_ROOT is defined as the root directory where QuantumGIS is installed.
Rendering Transformation
For our example we will use an already configured layer called Significant_height_of_combined_wind_waves_and_swell_surface from the store waves.
Check the style called dynamic having the following XML code:
<?xml version="1.0" encoding="ISO-8859-1"?>
<StyledLayerDescriptor version="1.0.0"
  xsi:schemaLocation="http://www.opengis.net/sld StyledLayerDescriptor.xsd"
  xmlns="http://www.opengis.net/sld"
  xmlns:ogc="http://www.opengis.net/ogc"
  xmlns:xlink="http://www.w3.org/1999/xlink"
  xmlns:xsi="http://www.w3.org/2001/XMLSchema-instance">
 <NamedLayer>
  <Name>dynamic</Name>
  <UserStyle>
    <Title>dynamic</Title>
    <Abstract>A DynamicColorMap</Abstract>
    <FeatureTypeStyle>
    <Transformation>
      <ogc:Function name="ras:DynamicColorMap">
       <ogc:Function name="parameter">
        <ogc:Literal>data</ogc:Literal>
       </ogc:Function>
       <ogc:Function name="parameter">
        <ogc:Literal>colorRamp</ogc:Literal>
        <ogc:Function name="colormap">
         <ogc:Literal>gmt\GMT_panoply</ogc:Literal>
         <ogc:Function name="gridCoverageStats"><ogc:Literal>minimum</ogc:Literal></ogc:Function>
         <ogc:Function name="gridCoverageStats"><ogc:Literal>maximum</ogc:Literal></ogc:Function>
        </ogc:Function>
       </ogc:Function>
      </ogc:Function>
    </Transformation>
    <Rule>
     <Name>rule1</Name>
     <RasterSymbolizer>
       <Opacity>1.0</Opacity>
     </RasterSymbolizer>
    </Rule>
    </FeatureTypeStyle>
  </UserStyle>
 </NamedLayer>
 </StyledLayerDescriptor>
You can see that this style uses the ras:DynamicColorMap process which calculates a dynamic colormap on the input data using the provided color Ramp. Maximum and minimum values are taken from the PAM Auxiliary files generated before. In this example we used the SVG file gmt\GMT_panoply with the colormap defined here:
<linearGradient id="GMT_panoply" gradientUnits="objectBoundingBox" spreadMethod="pad" x1="0%" x2="100%" y1="0%" y2="0%">
 <stop offset="0.00%" stop-color="rgb(4,14,216)" stop-opacity="1.0000"/>
 <stop offset="6.25%" stop-color="rgb(4,14,216)" stop-opacity="1.0000"/>
 <stop offset="6.25%" stop-color="rgb(32,80,255)" stop-opacity="1.0000"/>
 <stop offset="12.50%" stop-color="rgb(32,80,255)" stop-opacity="1.0000"/>
 <stop offset="12.50%" stop-color="rgb(65,150,255)" stop-opacity="1.0000"/>
 <stop offset="18.75%" stop-color="rgb(65,150,255)" stop-opacity="1.0000"/>
 <stop offset="18.75%" stop-color="rgb(109,193,255)" stop-opacity="1.0000"/>
 <stop offset="25.00%" stop-color="rgb(109,193,255)" stop-opacity="1.0000"/>
 <stop offset="25.00%" stop-color="rgb(134,217,255)" stop-opacity="1.0000"/>
 <stop offset="31.25%" stop-color="rgb(134,217,255)" stop-opacity="1.0000"/>
 <stop offset="31.25%" stop-color="rgb(156,238,255)" stop-opacity="1.0000"/>
 <stop offset="37.50%" stop-color="rgb(156,238,255)" stop-opacity="1.0000"/>
 <stop offset="37.50%" stop-color="rgb(175,245,255)" stop-opacity="1.0000"/>
 <stop offset="43.75%" stop-color="rgb(175,245,255)" stop-opacity="1.0000"/>
 <stop offset="43.75%" stop-color="rgb(206,255,255)" stop-opacity="1.0000"/>
 <stop offset="50.00%" stop-color="rgb(206,255,255)" stop-opacity="1.0000"/>
 <stop offset="50.00%" stop-color="rgb(255,254,71)" stop-opacity="1.0000"/>
 <stop offset="56.25%" stop-color="rgb(255,254,71)" stop-opacity="1.0000"/>
 <stop offset="56.25%" stop-color="rgb(255,235,0)" stop-opacity="1.0000"/>
 <stop offset="62.50%" stop-color="rgb(255,235,0)" stop-opacity="1.0000"/>
 <stop offset="62.50%" stop-color="rgb(255,196,0)" stop-opacity="1.0000"/>
 <stop offset="68.75%" stop-color="rgb(255,196,0)" stop-opacity="1.0000"/>
 <stop offset="68.75%" stop-color="rgb(255,144,0)" stop-opacity="1.0000"/>
 <stop offset="75.00%" stop-color="rgb(255,144,0)" stop-opacity="1.0000"/>
 <stop offset="75.00%" stop-color="rgb(255,72,0)" stop-opacity="1.0000"/>
 <stop offset="81.25%" stop-color="rgb(255,72,0)" stop-opacity="1.0000"/>
 <stop offset="81.25%" stop-color="rgb(255,0,0)" stop-opacity="1.0000"/>
 <stop offset="87.50%" stop-color="rgb(255,0,0)" stop-opacity="1.0000"/>
 <stop offset="87.50%" stop-color="rgb(213,0,0)" stop-opacity="1.0000"/>
 <stop offset="93.75%" stop-color="rgb(213,0,0)" stop-opacity="1.0000"/>
 <stop offset="93.75%" stop-color="rgb(158,0,0)" stop-opacity="1.0000"/>
 <stop offset="100.00%" stop-color="rgb(158,0,0)" stop-opacity="1.0000"/>
</linearGradient>
The colormap is rendered by the following image:

Execute the following WMS request:
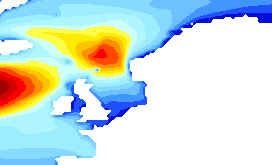
http://localhost:8083/geoserver/geosolutions/wms?TIME=2014-01-24T21:00:00.000Z&LAYERS=geosolutions:Significant_height_of_combined_wind_waves_and_swell_surface&STYLES=dynamic&FORMAT=image/png&SERVICE=WMS&VERSION=1.1.1&REQUEST=GetMap&SRS=EPSG:4326&BBOX=-21.814453125,40.85546875,34.814453125,75.14453125&WIDTH=272&HEIGHT=165
The result should be similar to this:
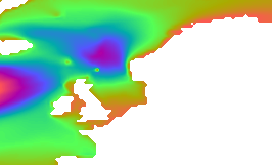
Create a new style called dynamic2 by copying the style above and substituting gmt\GMT_panoply with grass\wave. As you can see, this colormap is smoother than the one before:

Execute the WMS request below:
http://localhost:8083/geoserver/geosolutions/wms?TIME=2014-01-24T21:00:00.000Z&LAYERS=geosolutions:Significant_height_of_combined_wind_waves_and_swell_surface&STYLES=dynamic2&FORMAT=image/png&SERVICE=WMS&VERSION=1.1.1&REQUEST=GetMap&SRS=EPSG:4326&BBOX=-21.814453125,40.85546875,34.814453125,75.14453125&WIDTH=272&HEIGHT=165
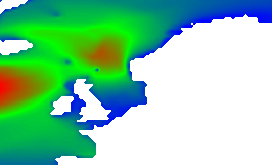
Create another style called dynamic3 by copying the first one and modify the <Transformation>...</Transformation> section with the following code:
<Transformation>
   <ogc:Function name="ras:DynamicColorMap">
         <ogc:Function name="parameter">
           <ogc:Literal>data</ogc:Literal>
         </ogc:Function>
         <ogc:Function name="parameter">
           <ogc:Literal>colorRamp</ogc:Literal>
           <ogc:Function name="colormap">
                 <ogc:Literal>#0000FF;#00FF00;#FF0000</ogc:Literal>
                 <ogc:Function name="gridCoverageStats"><ogc:Literal>minimum</ogc:Literal></ogc:Function>
                 <ogc:Function name="gridCoverageStats"><ogc:Literal>maximum</ogc:Literal></ogc:Function>
           </ogc:Function>
         </ogc:Function>
   </ogc:Function>
</Transformation>
The <ogc:Literal>#0000FF;#00FF00;#FF0000</ogc:Literal> block represents the color ramp used for generating the dynamic colormap.
Execute the WMS request below:
http://localhost:8083/geoserver/geosolutions/wms?TIME=2014-01-24T21:00:00.000Z&LAYERS=geosolutions:Significant_height_of_combined_wind_waves_and_swell_surface&STYLES=dynamic3&FORMAT=image/png&SERVICE=WMS&VERSION=1.1.1&REQUEST=GetMap&SRS=EPSG:4326&BBOX=-21.814453125,40.85546875,34.814453125,75.14453125&WIDTH=272&HEIGHT=165
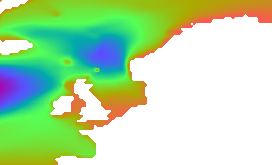
Alternatively, in case there is no need to use statistics (as an instance to use a common values range across all datasets and dimensions) you can manually set the minimum and maximum values.
Open the dynamic3 style
Copy the following block in the <Transformation> section. Then save the style.
<Transformation>
   <ogc:Function name="ras:DynamicColorMap">
         <ogc:Function name="parameter">
           <ogc:Literal>data</ogc:Literal>
         </ogc:Function>
         <ogc:Function name="parameter">
           <ogc:Literal>colorRamp</ogc:Literal>
           <ogc:Function name="colormap">
                 <ogc:Literal>grass\wave</ogc:Literal>
                 <ogc:Literal>0</ogc:Literal>
                 <ogc:Literal>15</ogc:Literal>
           </ogc:Function>
         </ogc:Function>
   </ogc:Function>
</Transformation>
Execute the following WMS request:
http://localhost:8083/geoserver/geosolutions/wms?TIME=2014-01-24T21:00:00.000Z&LAYERS=geosolutions:Significant_height_of_combined_wind_waves_and_swell_surface&STYLES=dynamic3&FORMAT=image/png&SERVICE=WMS&VERSION=1.1.1&REQUEST=GetMap&SRS=EPSG:4326&BBOX=-21.814453125,40.85546875,34.814453125,75.14453125&WIDTH=272&HEIGHT=165
In these chapters we have shown how to get portrayal or rendering of the available data. The next section will introduce how to get actual raw data values, through the WCS service.