GeoServer Integration: rendering transformations
Geometry transformations have been added some time ago to GeoTools to allow the application of a filter function on geometries before rendering it.
This allows for quite a bit of flexibility, yet still fails to address some needs:
- transformations that do need to take into account more than one feature at a time
- transformations that perform raster to vector transformations, like contouring.
The recent evolutions in processing land suggest we can do these kind of transformations by bridging between the SLD world and the process/WPS world, allowing the user to invoke a process that would sit in between the data source and the rendering engine.
The SLD style sheet is a neat place to do this as it allow for dynamic applications to be written that would just change the style on the fly to extract different views out of a given data set (for example, changing on the fly the contour levels to be extracted)
Now, most of the meaningful rendering transformation can also be considered as valuable stand alone processes. It makes sense to bridge the two worlds so that SLD can call onto a process via the above transformation.
This is achieved by a filter/process bridge, a FunctionFactory called ProcessFunctionFactory which looks for all processes that will return just one result and that generates function wrappers around them. In fact, a function is just a process that returns a single output, and vice versa, any process returning a single output can be seen as a function.
There is however a mismatch to be solved, function arguments are positional, process arguments are named instead. The mismatch has been solved by making the process function wrappers access parameters that are maps from a string (the argument name) to a value, and creating a function, called “parameter” that builds those maps.
The “parameter” function will assume the first argument is always the parameter name, while the value of the returned map will be:
- its context (the feature collection or the coverage) if the argument is just one (which is assumed to be the process parameter name)
- the second argument if there are only two
- a List collecting all of the arguments besides the first if there are more than two
This takes care of all the normal needs, that is, passing the source dataset to the process, passing a given single valued argument, or passing down a multivalued argument.
This allows to build a transformation in SLD that looks as follows:
<FeatureTypeStyle>
    <Transformation>
      <ogc:Function name="gs:Contour">
          <ogc:Function name="parameter">
            <ogc:Literal>data</ogc:Literal>
          </ogc:Function>
          <ogc:Function name="parameter">
            <ogc:Literal>levels</ogc:Literal>
            <ogc:Literal>1100</ogc:Literal>
            <ogc:Literal>1200</ogc:Literal>
            <ogc:Literal>1300</ogc:Literal>
            <ogc:Literal>1400</ogc:Literal>
            <ogc:Literal>1500</ogc:Literal>
            <ogc:Literal>1600</ogc:Literal>
            <ogc:Literal>1700</ogc:Literal>
            <ogc:Literal>1800</ogc:Literal>
          </ogc:Function>
      </ogc:Function>
    </Transformation>
    <Rule>
    ...
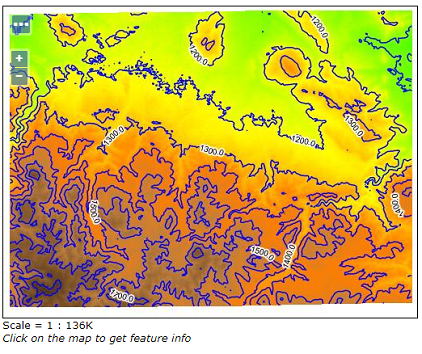
Contour extraction
In this case the transformation extracts contours out of a DEM at user specified levels and then paints them labeling them according to their elevation.
Go to the GeoServer Layer Preview and select the Layer
geosolutions:demModify the WMS
GetMapURL by updating those two parameters as follows:- layers=geosolutions:dem,geosolutions:dem
- styles=,g_contour
The final URL should be
http://localhost:8083/geoserver/geosolutions/wms?service=WMS&version=1.1.0&request=GetMap&layers=geosolutions:dem,geosolutions:dem&styles=,g_contour&bbox=589980.0,4913700.0,609000.0,4928010.0&width=512&height=385&srs=EPSG:26713&format=application/openlayers
Zoom in and out in order to see the on-the-fly generated contours for the DEM layer
The
g_contourstyle appear like this (it can be edited from the GeoServer Style page)
1 2 3 4 5 6 7 8 9 10 11 12 13 14 15 16 17 18 19 20 21 22 23 24 25 26 27 28 29 30 31 32 33 34 35 36 37 38 39 40 41 42 43 44 45 46 47 48 49 50 51 52 53 54 55 56 57 58 59 60 61 62 63 64 65 66 67 68 69 70 71 72 73 74 75 76 77 78 79 80 81 82 83 84 | <?xml version="1.0" encoding="ISO-8859-1"?>
<StyledLayerDescriptor version="1.0.0"
xsi:schemaLocation="http://www.opengis.net/sld StyledLayerDescriptor.xsd"
xmlns="http://www.opengis.net/sld"
xmlns:ogc="http://www.opengis.net/ogc"
xmlns:xlink="http://www.w3.org/1999/xlink"
xmlns:xsi="http://www.w3.org/2001/XMLSchema-instance">
<!-- a Named Layer is the basic building block of an SLD document -->
<NamedLayer>
<Name>default_line</Name>
<UserStyle>
<!-- Styles can have names, titles and abstracts -->
<Title>Default Line</Title>
<Abstract>A sample style that draws a line</Abstract>
<!-- FeatureTypeStyles describe how to render different features -->
<!-- A FeatureTypeStyle for rendering lines -->
<FeatureTypeStyle>
<Transformation>
<ogc:Function name="gs:Contour">
<ogc:Function name="parameter">
<ogc:Literal>data</ogc:Literal>
</ogc:Function>
<ogc:Function name="parameter">
<ogc:Literal>levels</ogc:Literal>
<ogc:Literal>1100</ogc:Literal>
<ogc:Literal>1200</ogc:Literal>
<ogc:Literal>1300</ogc:Literal>
<ogc:Literal>1400</ogc:Literal>
<ogc:Literal>1500</ogc:Literal>
<ogc:Literal>1600</ogc:Literal>
<ogc:Literal>1700</ogc:Literal>
<ogc:Literal>1800</ogc:Literal>
</ogc:Function>
</ogc:Function>
</Transformation>
<Rule>
<Name>rule1</Name>
<Title>Blue Line</Title>
<Abstract>A solid blue line with a 1 pixel width</Abstract>
<LineSymbolizer>
<Stroke>
<CssParameter name="stroke">#0000FF</CssParameter>
</Stroke>
</LineSymbolizer>
<TextSymbolizer>
<Label>
<ogc:PropertyName>value</ogc:PropertyName>
</Label>
<Font>
<CssParameter name="font-family">Arial</CssParameter>
<CssParameter name="font-style">Normal</CssParameter>
<CssParameter name="font-size">10</CssParameter>
</Font>
<LabelPlacement>
<LinePlacement>
</LinePlacement>
</LabelPlacement>
<Halo>
<Radius>
<ogc:Literal>2</ogc:Literal>
</Radius>
<Fill>
<CssParameter name="fill">#FFFFFF</CssParameter>
<CssParameter name="fill-opacity">0.85</CssParameter>
</Fill>
</Halo>
<Fill>
<CssParameter name="fill">#000000</CssParameter>
</Fill>
<VendorOption name="followLine">true</VendorOption>
<VendorOption name="repeat">200</VendorOption>
<VendorOption name="maxDisplacement">50</VendorOption>
<VendorOption name="maxAngleDelta">30</VendorOption>
</TextSymbolizer>
</Rule>
</FeatureTypeStyle>
</UserStyle>
</NamedLayer>
</StyledLayerDescriptor>
|
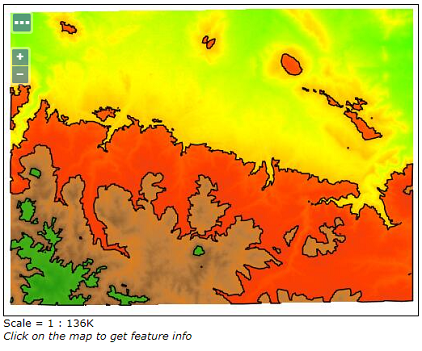
Contour extraction styled as Polygons
In this case the transformation extracts contours out of a DEM at user specified levels and then paints them as polygons according to their elevation.
Go to the GeoServer Layer Preview and select the Layer
geosolutions:demModify the WMS
GetMapURL by updating those two parameters as follows:- layers=geosolutions:dem,geosolutions:dem
- styles=,g_polygons
The final URL should be
http://localhost:8083/geoserver/geosolutions/wms?service=WMS&version=1.1.0&request=GetMap&layers=geosolutions:dem,geosolutions:dem&styles=,g_polygons&bbox=589980.0,4913700.0,609000.0,4928010.0&width=512&height=385&srs=EPSG:26713&format=application/openlayers
Zoom in and out in order to see the on-the-fly generated contours for the DEM layer
The
g_polygonsstyle appear like this (it can be edited from the GeoServer Style page)
1 2 3 4 5 6 7 8 9 10 11 12 13 14 15 16 17 18 19 20 21 22 23 24 25 26 27 28 29 30 31 32 33 34 35 36 37 38 39 40 41 42 43 44 45 46 47 48 49 50 51 52 53 54 55 56 57 58 59 60 61 62 63 64 65 66 67 68 | <?xml version="1.0" encoding="ISO-8859-1"?>
<StyledLayerDescriptor version="1.0.0"
xsi:schemaLocation="http://www.opengis.net/sld StyledLayerDescriptor.xsd"
xmlns="http://www.opengis.net/sld"
xmlns:ogc="http://www.opengis.net/ogc"
xmlns:xlink="http://www.w3.org/1999/xlink"
xmlns:xsi="http://www.w3.org/2001/XMLSchema-instance">
<!-- a Named Layer is the basic building block of an SLD document -->
<NamedLayer>
<Name>default_line</Name>
<UserStyle>
<!-- Styles can have names, titles and abstracts -->
<Title>Default Line</Title>
<Abstract>A sample style that draws a line</Abstract>
<!-- FeatureTypeStyles describe how to render different features -->
<!-- A FeatureTypeStyle for rendering lines -->
<FeatureTypeStyle>
<Transformation>
<ogc:Function name="gs:PolygonExtraction">
<ogc:Function name="parameter">
<ogc:Literal>data</ogc:Literal>
</ogc:Function>
<ogc:Function name="parameter">
<ogc:Literal>ranges</ogc:Literal>
<ogc:Literal>[1300;1500]</ogc:Literal>
<ogc:Literal>(1700;1900]</ogc:Literal>
</ogc:Function>
</ogc:Function>
</Transformation>
<Rule>
<Name>range1</Name>
<Title>First range</Title>
<ogc:Filter>
<ogc:PropertyIsEqualTo>
<ogc:PropertyName>value</ogc:PropertyName>
<ogc:Literal>1</ogc:Literal>
</ogc:PropertyIsEqualTo>
</ogc:Filter>
<PolygonSymbolizer>
<Fill>
<CssParameter name="fill">#FF0000</CssParameter>
<CssParameter name="fill-opacity">0.5</CssParameter>
</Fill>
<Stroke/>
</PolygonSymbolizer>
</Rule>
<Rule>
<Name>range2</Name>
<Title>Second range</Title>
<ogc:Filter>
<ogc:PropertyIsEqualTo>
<ogc:PropertyName>value</ogc:PropertyName>
<ogc:Literal>2</ogc:Literal>
</ogc:PropertyIsEqualTo>
</ogc:Filter>
<PolygonSymbolizer>
<Fill>
<CssParameter name="fill">#00FF00</CssParameter>
<CssParameter name="fill-opacity">0.5</CssParameter>
</Fill>
<Stroke/>
</PolygonSymbolizer>
</Rule>
</FeatureTypeStyle>
</UserStyle>
</NamedLayer>
</StyledLayerDescriptor>
|
Point extraction
In this case the transformation extracts points out of a DEM at user specified levels. The points will be visible only at higher zoom levels due to the scale-denominator.
Go to the GeoServer Layer Preview and select the Layer
geosolutions:demModify the WMS
GetMapURL by updating those two parameters as follows:- layers=geosolutions:dem,geosolutions:dem,geosolutions:dem
- styles=,g_point,g_contour
The final URL should be
http://localhost:8083/geoserver/geosolutions/wms?service=WMS&version=1.1.0&request=GetMap&layers=geosolutions:dem,geosolutions:dem,geosolutions:dem&styles=,g_point,g_contour&bbox=589980.0,4913700.0,609000.0,4928010.0&width=512&height=385&srs=EPSG:26713&format=application/openlayers
Zoom in until the points labels appear in order to see the on-the-fly generated contours and points for the DEM layer
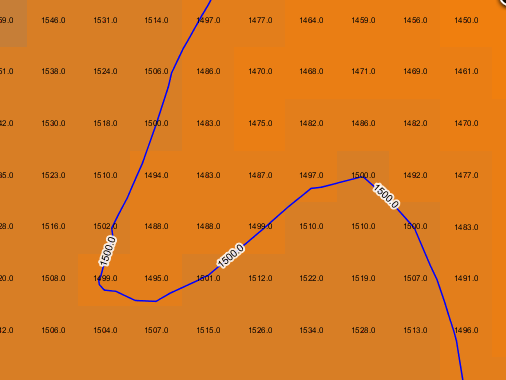
Warning
The SLD that exposes the values for each single raster cell uses a maxScaleDenominator directive to limit the rendering of the values to certain zoom levels. Make sure to zoom in until you make numbers appear above the DEM colors!
- The
g_pointstyle appear like this (it can be edited from the GeoServer Style page)
1 2 3 4 5 6 7 8 9 10 11 12 13 14 15 16 17 18 19 20 21 22 23 24 25 26 27 28 29 30 31 32 33 34 35 36 37 38 | <?xml version="1.0" encoding="ISO-8859-1"?>
<StyledLayerDescriptor version="1.0.0"
xsi:schemaLocation="http://www.opengis.net/sld StyledLayerDescriptor.xsd"
xmlns="http://www.opengis.net/sld" xmlns:ogc="http://www.opengis.net/ogc"
xmlns:xlink="http://www.w3.org/1999/xlink" xmlns:xsi="http://www.w3.org/2001/XMLSchema-instance">
<NamedLayer>
<Name>default_line</Name>
<UserStyle>
<Title>Default Line</Title>
<Abstract>A sample style that draws a line</Abstract>
<FeatureTypeStyle>
<Transformation>
<ogc:Function name="gs:RasterAsPointCollection">
<ogc:Function name="parameter">
<ogc:Literal>data</ogc:Literal>
</ogc:Function>
</ogc:Function>
</Transformation>
<Rule>
<maxScaleDenominator>2100</maxScaleDenominator>
<TextSymbolizer>
<Label>
<ogc:PropertyName>GRAY_INDEX</ogc:PropertyName>
</Label>
<Font>
<CssParameter name="font-family">Arial</CssParameter>
<CssParameter name="font-style">Normal</CssParameter>
<CssParameter name="font-size">8</CssParameter>
</Font>
<Fill>
<CssParameter name="fill">#000000</CssParameter>
</Fill>
</TextSymbolizer>
</Rule>
</FeatureTypeStyle>
</UserStyle>
</NamedLayer>
</StyledLayerDescriptor>
|
Wind arrows
The process gs:RasterAsPointCollection can be used also for dynamically drawing wind arrows for instance.
In this case we have a raster layer with two float64 bands containing the u and v components or a wind vector. The style first extracts the pixel centers as a list of points whose attributes are u and v, then composes them to generate magnitude and direction of the wind arrow, finally it activates conflict resolution so that no two arrows overlap with each other.
Go to the GeoServer Layer Preview and select the Layer
geosolutions:windClick on the
Toggle Options Toolbarbutton on the map, and try to change the styles fromg_arrows2tog_arrows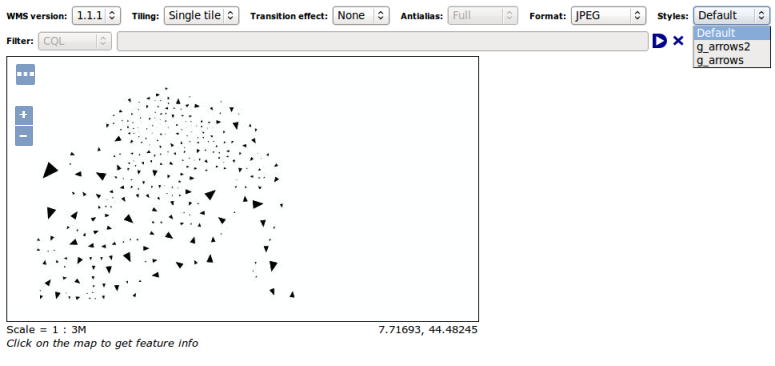
Note
The styles
g_arrowsandg_arrows2, compute magnitude and direction of the arrow on the fly by using filter functions.The
g_arrowsstyle, enabling conflict resolutions, appear like below (it can be edited from the GeoServer Style page)
1 2 3 4 5 6 7 8 9 10 11 12 13 14 15 16 17 18 19 20 21 22 23 24 25 26 27 28 29 30 31 32 33 34 35 36 37 38 39 40 41 42 43 44 45 46 47 48 49 50 51 52 53 54 55 56 57 58 59 60 61 62 63 64 65 66 67 68 69 70 | <StyledLayerDescriptor version="1.0.0"
xmlns="http://www.opengis.net/sld" xmlns:gml="http://www.opengis.net/gml"
xmlns:ogc="http://www.opengis.net/ogc" xmlns:xlink="http://www.w3.org/1999/xlink"
xmlns:xsi="http://www.w3.org/2001/XMLSchema-instance"
xsi:schemaLocation="http://www.opengis.net/sld ./StyledLayerDescriptor.xsd">
<NamedLayer>
<Name>contour_lines</Name>
<UserStyle>
<FeatureTypeStyle>
<Transformation>
<ogc:Function name="gs:RasterAsPointCollection">
<ogc:Function name="parameter">
<ogc:Literal>data</ogc:Literal>
</ogc:Function>
</ogc:Function>
</Transformation>
<Rule>
<TextSymbolizer>
<Label><![CDATA[ ]]></Label> <!-- fake label -->
<Graphic>
<Mark>
<WellKnownName>shape://carrow</WellKnownName>
<Fill>
<CssParameter name="fill">#000000</CssParameter>
</Fill>
</Mark>
<Size>
<ogc:Mul>
<ogc:Function name="sqrt">
<ogc:Add>
<ogc:Mul>
<ogc:PropertyName>Band1</ogc:PropertyName>
<ogc:PropertyName>Band1</ogc:PropertyName>
</ogc:Mul>
<ogc:Mul>
<ogc:PropertyName>Band2</ogc:PropertyName>
<ogc:PropertyName>Band2</ogc:PropertyName>
</ogc:Mul>
</ogc:Add>
</ogc:Function>
<ogc:Literal>200</ogc:Literal>
</ogc:Mul>
</Size>
<Rotation>
<ogc:Function name="toDegrees">
<ogc:Function name="atan2">
<ogc:PropertyName>Band2</ogc:PropertyName>
<ogc:PropertyName>Band1</ogc:PropertyName>
</ogc:Function>
</ogc:Function>
</Rotation>
</Graphic>
<Priority>
<ogc:Add>
<ogc:Mul>
<ogc:PropertyName>Band1</ogc:PropertyName>
<ogc:PropertyName>Band1</ogc:PropertyName>
</ogc:Mul>
<ogc:Mul>
<ogc:PropertyName>Band2</ogc:PropertyName>
<ogc:PropertyName>Band2</ogc:PropertyName>
</ogc:Mul>
</ogc:Add>
</Priority>
</TextSymbolizer>
</Rule>
</FeatureTypeStyle>
</UserStyle>
</NamedLayer>
</StyledLayerDescriptor>
|
- The
g_arrows2style, disabling conflict resolutions, appear like below (it can be edited from the GeoServer Style page)
1 2 3 4 5 6 7 8 9 10 11 12 13 14 15 16 17 18 19 20 21 22 23 24 25 26 27 28 29 30 31 32 33 34 35 36 37 38 39 40 41 42 43 44 45 46 47 48 49 50 51 52 53 54 55 56 57 58 59 60 61 62 63 64 65 66 67 68 69 70 71 | <StyledLayerDescriptor version="1.0.0"
xmlns="http://www.opengis.net/sld" xmlns:gml="http://www.opengis.net/gml"
xmlns:ogc="http://www.opengis.net/ogc" xmlns:xlink="http://www.w3.org/1999/xlink"
xmlns:xsi="http://www.w3.org/2001/XMLSchema-instance"
xsi:schemaLocation="http://www.opengis.net/sld ./StyledLayerDescriptor.xsd">
<NamedLayer>
<Name>contour_lines</Name>
<UserStyle>
<FeatureTypeStyle>
<Transformation>
<ogc:Function name="gs:RasterAsPointCollection">
<ogc:Function name="parameter">
<ogc:Literal>data</ogc:Literal>
</ogc:Function>
</ogc:Function>
</Transformation>
<Rule>
<TextSymbolizer>
<Label><![CDATA[ ]]></Label> <!-- fake label -->
<Graphic>
<Mark>
<WellKnownName>shape://carrow</WellKnownName>
<Fill>
<CssParameter name="fill">#000000</CssParameter>
</Fill>
</Mark>
<Size>
<ogc:Mul>
<ogc:Function name="sqrt">
<ogc:Add>
<ogc:Mul>
<ogc:PropertyName>Band1</ogc:PropertyName>
<ogc:PropertyName>Band1</ogc:PropertyName>
</ogc:Mul>
<ogc:Mul>
<ogc:PropertyName>Band2</ogc:PropertyName>
<ogc:PropertyName>Band2</ogc:PropertyName>
</ogc:Mul>
</ogc:Add>
</ogc:Function>
<ogc:Literal>200</ogc:Literal>
</ogc:Mul>
</Size>
<Rotation>
<ogc:Function name="toDegrees">
<ogc:Function name="atan2">
<ogc:PropertyName>Band2</ogc:PropertyName>
<ogc:PropertyName>Band1</ogc:PropertyName>
</ogc:Function>
</ogc:Function>
</Rotation>
</Graphic>
<Priority>
<ogc:Add>
<ogc:Mul>
<ogc:PropertyName>Band1</ogc:PropertyName>
<ogc:PropertyName>Band1</ogc:PropertyName>
</ogc:Mul>
<ogc:Mul>
<ogc:PropertyName>Band2</ogc:PropertyName>
<ogc:PropertyName>Band2</ogc:PropertyName>
</ogc:Mul>
</ogc:Add>
</Priority>
<VendorOption name="conflictResolution">false</VendorOption>
</TextSymbolizer>
</Rule>
</FeatureTypeStyle>
</UserStyle>
</NamedLayer>
</StyledLayerDescriptor>
|
Point Stacker
All the previous transformations used raster sources, let’s take a look at one that takes a vector.
Go to the GeoServer Layer Preview and select the Layer
geosolutions:bptlandmarksModify the WMS
GetMapURL by updating those two parameters as follows:- layers=geosolutions:bptlandmarks,geosolutions:bptlandmarks
- styles=point,g_stacker
The final URL should be
http://localhost:8083/geoserver/geosolutions/wms?service=WMS&version=1.1.0&request=GetMap&layers=geosolutions:bptlandmarks,geosolutions:bptlandmarks&styles=point,g_stacker&bbox=-105.688,39.914,-105.06,40.261&width=597&height=330&srs=EPSG:4269&format=application/openlayers
This transformation returns a
FeatureCollectionof points, with the attributecountholding the number of points that are close together.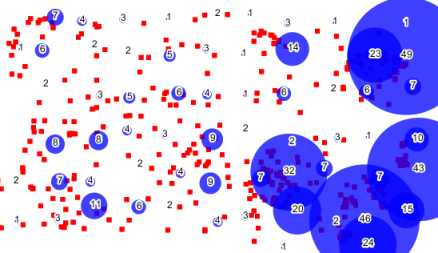
The
g_stackerstyle appear like this (it can be edited from the GeoServer Style page)
1 2 3 4 5 6 7 8 9 10 11 12 13 14 15 16 17 18 19 20 21 22 23 24 25 26 27 28 29 30 31 32 33 34 35 36 37 38 39 40 41 42 43 44 45 46 47 48 49 50 51 52 53 54 55 56 57 58 59 60 61 62 63 64 65 66 67 68 69 70 71 72 73 74 75 76 77 78 79 80 81 82 83 84 85 86 87 88 89 90 91 92 93 94 95 | <?xml version="1.0" encoding="ISO-8859-1"?>
<StyledLayerDescriptor version="1.0.0"
xsi:schemaLocation="http://www.opengis.net/sld StyledLayerDescriptor.xsd"
xmlns="http://www.opengis.net/sld" xmlns:ogc="http://www.opengis.net/ogc"
xmlns:xlink="http://www.w3.org/1999/xlink" xmlns:xsi="http://www.w3.org/2001/XMLSchema-instance">
<NamedLayer>
<Name>g_stacker</Name>
<UserStyle>
<Title>Point Stacker</Title>
<Abstract>A sample style that aggregates points</Abstract>
<FeatureTypeStyle>
<Transformation>
<ogc:Function name="gs:PointStacker">
<ogc:Function name="parameter">
<ogc:Literal>data</ogc:Literal>
</ogc:Function>
<ogc:Function name="parameter">
<ogc:Literal>cellSize</ogc:Literal>
<ogc:Literal>50</ogc:Literal>
</ogc:Function>
<ogc:Function name="parameter">
<ogc:Literal>outputBBOX</ogc:Literal>
<ogc:Function name="env">
<ogc:Literal>wms_bbox</ogc:Literal>
</ogc:Function>
</ogc:Function>
<ogc:Function name="parameter">
<ogc:Literal>outputWidth</ogc:Literal>
<ogc:Function name="env">
<ogc:Literal>wms_width</ogc:Literal>
</ogc:Function>
</ogc:Function>
<ogc:Function name="parameter">
<ogc:Literal>outputHeight</ogc:Literal>
<ogc:Function name="env">
<ogc:Literal>wms_height</ogc:Literal>
</ogc:Function>
</ogc:Function>
</ogc:Function>
</Transformation>
<Rule>
<PointSymbolizer>
<Graphic>
<Mark>
<WellKnownName>circle</WellKnownName>
<Fill>
<CssParameter name="fill">#0000FF</CssParameter>
<CssParameter name="fill-opacity">0.5</CssParameter>
</Fill>
</Mark>
<Size><ogc:Mul><ogc:PropertyName>countunique</ogc:PropertyName><ogc:Literal>3</ogc:Literal></ogc:Mul></Size>
</Graphic>
</PointSymbolizer>
<TextSymbolizer>
<Label>
<ogc:PropertyName>countunique</ogc:PropertyName>
</Label>
<Font>
<CssParameter name="font-family">Arial</CssParameter>
<CssParameter name="font-size">12.0</CssParameter>
<CssParameter name="font-style">normal</CssParameter>
<CssParameter name="font-weight">normal</CssParameter>
</Font>
<LabelPlacement>
<PointPlacement>
<AnchorPoint>
<AnchorPointX>
<ogc:Literal>0.5</ogc:Literal>
</AnchorPointX>
<AnchorPointY>
<ogc:Literal>0.5</ogc:Literal>
</AnchorPointY>
</AnchorPoint>
<Rotation>
<ogc:Literal>0.0</ogc:Literal>
</Rotation>
</PointPlacement>
</LabelPlacement>
<Halo>
<Radius>
<ogc:Literal>2</ogc:Literal>
</Radius>
<Fill>
<CssParameter name="fill">#FFFFFF</CssParameter>
</Fill>
</Halo>
<Fill>
<CssParameter name="fill">#000000</CssParameter>
</Fill>
</TextSymbolizer>
</Rule>
</FeatureTypeStyle>
</UserStyle>
</NamedLayer>
</StyledLayerDescriptor>
|
Note that the wms_bbox, wms_width and wms_height parameters are set using the name="env" attribute, meaning that they are determined from the WMS request making the style more flexible.
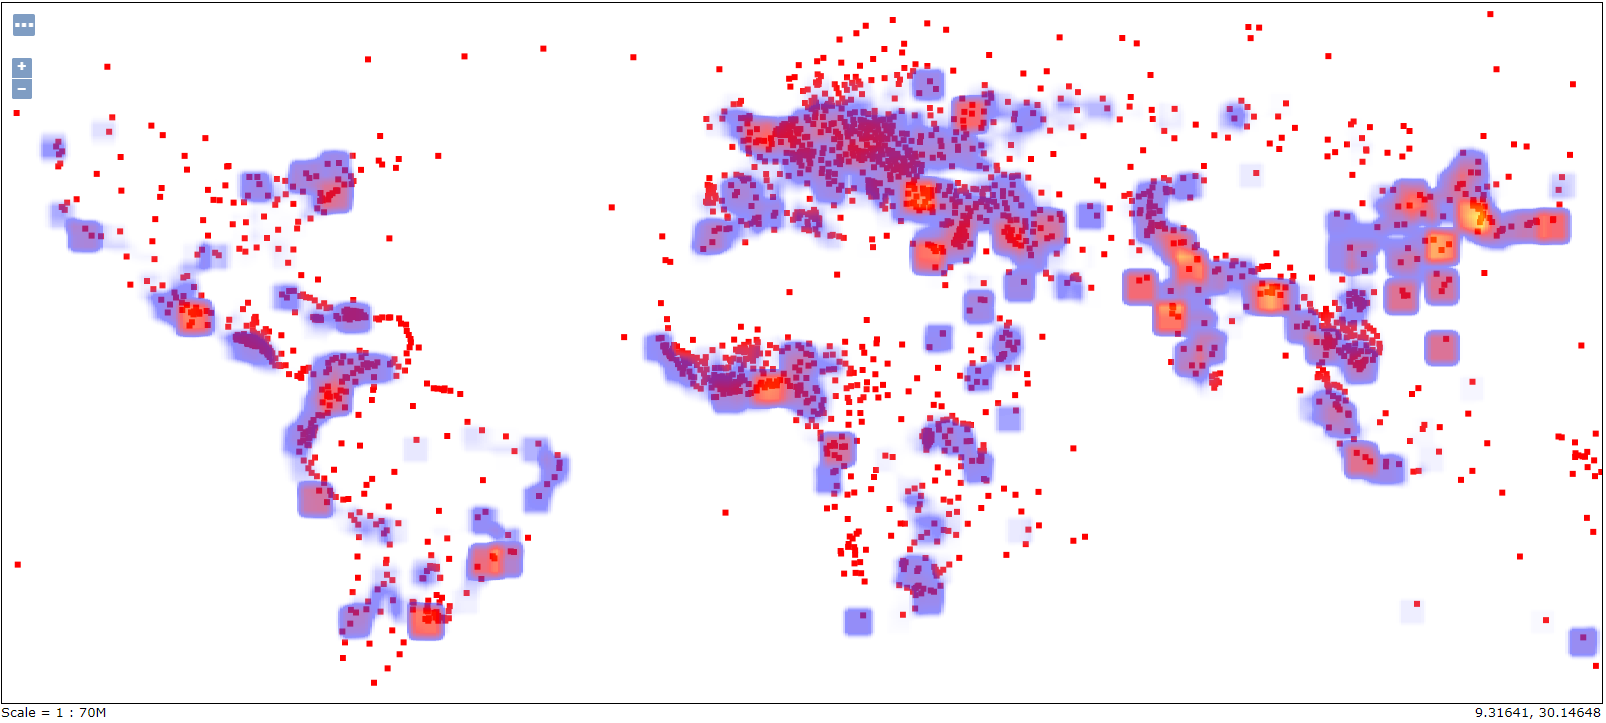
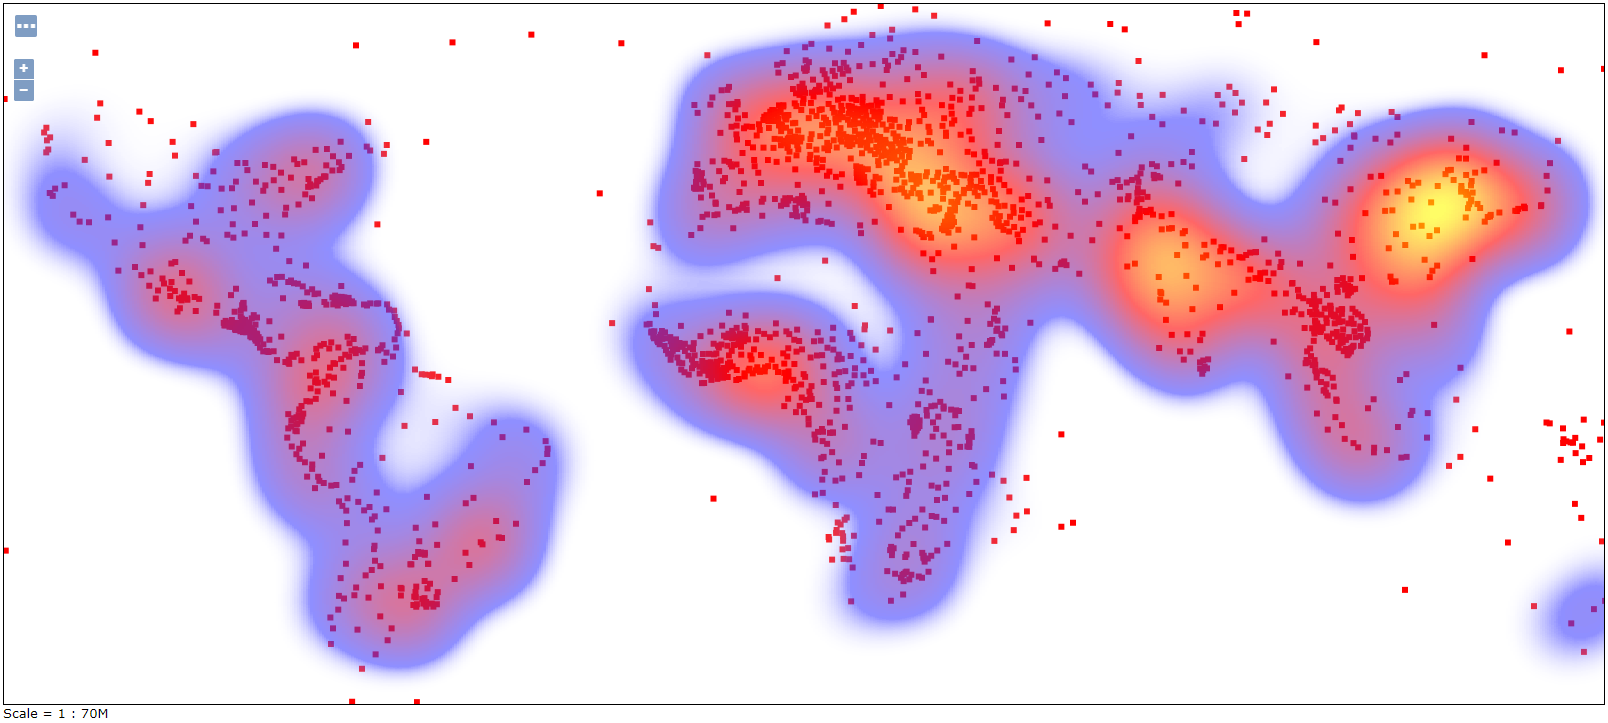
Heatmaps
This transformation (vec:Heatmap) is a Vector-to-Raster rendering transformation which generates a heatmap surface from weighted point data.
The following SLD invokes a Heatmap rendering transformation on a featuretype with point geometries and an attribute POP supplying the weight for the points (in this example, a dataset of world cities is used).
The output is styled using a color ramp across the output data value range [0 .. 1].
1 2 3 4 5 6 7 8 9 10 11 12 13 14 15 16 17 18 19 20 21 22 23 24 25 26 27 28 29 30 31 32 33 34 35 36 37 38 39 40 41 42 43 44 45 46 47 48 49 50 51 52 53 54 55 56 57 58 59 60 61 62 63 64 65 66 67 68 69 70 71 72 73 74 | <?xml version="1.0" encoding="ISO-8859-1"?>
<StyledLayerDescriptor version="1.0.0"
xsi:schemaLocation="http://www.opengis.net/sld StyledLayerDescriptor.xsd"
xmlns="http://www.opengis.net/sld"
xmlns:ogc="http://www.opengis.net/ogc"
xmlns:xlink="http://www.w3.org/1999/xlink"
xmlns:xsi="http://www.w3.org/2001/XMLSchema-instance">
<NamedLayer>
<Name>Heatmap</Name>
<UserStyle>
<Title>Heatmap</Title>
<Abstract>A heatmap surface showing population density</Abstract>
<FeatureTypeStyle>
<Transformation>
<ogc:Function name="vec:Heatmap">
<ogc:Function name="parameter">
<ogc:Literal>data</ogc:Literal>
</ogc:Function>
<ogc:Function name="parameter">
<ogc:Literal>weightAttr</ogc:Literal>
<ogc:Literal>POP</ogc:Literal>
</ogc:Function>
<ogc:Function name="parameter">
<ogc:Literal>radiusPixels</ogc:Literal>
<ogc:Function name="env">
<ogc:Literal>radius</ogc:Literal>
<ogc:Literal>100</ogc:Literal>
</ogc:Function>
</ogc:Function>
<ogc:Function name="parameter">
<ogc:Literal>pixelsPerCell</ogc:Literal>
<ogc:Literal>10</ogc:Literal>
</ogc:Function>
<ogc:Function name="parameter">
<ogc:Literal>outputBBOX</ogc:Literal>
<ogc:Function name="env">
<ogc:Literal>wms_bbox</ogc:Literal>
</ogc:Function>
</ogc:Function>
<ogc:Function name="parameter">
<ogc:Literal>outputWidth</ogc:Literal>
<ogc:Function name="env">
<ogc:Literal>wms_width</ogc:Literal>
</ogc:Function>
</ogc:Function>
<ogc:Function name="parameter">
<ogc:Literal>outputHeight</ogc:Literal>
<ogc:Function name="env">
<ogc:Literal>wms_height</ogc:Literal>
</ogc:Function>
</ogc:Function>
</ogc:Function>
</Transformation>
<Rule>
<RasterSymbolizer>
<!-- specify geometry attribute to pass validation -->
<Geometry>
<ogc:PropertyName>the_geom</ogc:PropertyName></Geometry>
<Opacity>0.6</Opacity>
<ColorMap type="ramp" >
<ColorMapEntry color="#FFFFFF" quantity="0" label="nodata"
opacity="0"/>
<ColorMapEntry color="#FFFFFF" quantity="0.02" label="nodata"
opacity="0"/>
<ColorMapEntry color="#4444FF" quantity=".1" label="nodata"/>
<ColorMapEntry color="#FF0000" quantity=".5" label="values" />
<ColorMapEntry color="#FFFF00" quantity="1.0" label="values" />
</ColorMap>
</RasterSymbolizer>
</Rule>
</FeatureTypeStyle>
</UserStyle>
</NamedLayer>
</StyledLayerDescriptor>
|
Key aspects of the SLD are:
- Line 15 define the rendering transformation, using the process vec:Heatmap.
- Lines 16-18 supply the input data parameter, named data in this process.
- Lines 19-22 supply a value for the process’s weightAttr parameter, which specifies the input attribute providing a weight for each data point.
- Lines 23-29 supply the value for the radiusPixels parameter, which controls the “spread” of the heatmap around each point. In this SLD the value of this parameter may be supplied by a SLD substitution variable called radius, with a default value of 100 pixels.
- Lines 30-33 supply the pixelsPerCell parameter, which controls the resolution at which the heatmap raster is computed.
- Lines 34-38 supply the outputBBOX parameter, which is given the value of the standard SLD environment variable wms_bbox.
- Lines 40-45 supply the outputWidth parameter, which is given the value of the standard SLD environment variable wms_width.
- Lines 46-52 supply the outputHeight parameter, which is given the value of the standard SLD environment variable wms_height.
- Lines 55-70 specify a RasterSymbolizer to style the computed raster surface. The symbolizer contains a ramped color map for the data range [0..1].
- Line 58 specifies the geometry attribute of the input featuretype, which is necessary to pass SLD validation.
Go to the GeoServer Layer Preview and select the Layer
geosolutions:world_cities_gmdModify the WMS
GetMapURL by updating those two parameters as follows:- layers=geosolutions:world_cities_gmd,geosolutions:world_cities_gmd
- styles=point,g_heatmaps
The final URL should be
http://localhost:8083/geoserver/geosolutions/wms?service=WMS&version=1.1.0&request=GetMap&layers=geosolutions%3Aworld_cities_gmd,geosolutions%3Aworld_cities_gmd&bbox=-175.245650649682%2C-54.79200000000003%2C179.22188736363634%2C78.20000103138693&width=768&height=330&srs=EPSG%3A4326&styles=point,g_heatmaps&format=application/openlayers
Modify the WMS
GetMapURL by changing the radius parameter value:- env=radius:10
The final URL should be
http://localhost:8083/geoserver/geosolutions/wms?service=WMS&version=1.1.0&request=GetMap&layers=geosolutions%3Aworld_cities_gmd,geosolutions%3Aworld_cities_gmd&bbox=-175.245650649682%2C-54.79200000000003%2C179.22188736363634%2C78.20000103138693&width=768&height=330&srs=EPSG%3A4326&styles=point,g_heatmaps&env=radius:10&format=application/openlayers#toggle