
GeoServer Integration: rendering transformations
Geometry transformations have been added almost one year ago to GeoTools to allow the application of a filter function to the geometry before rendering it.
This allows for quite a bit of flexibility, yet still fails to address some needs:
- transformations that do need to take into account more than one feature at a time
- transformations that perform raster to vector transformations, like contouring.
The recent evolutions in processing land suggest we can do these kind of transformations by bridging between the SLD world the the process/WPS world, allowing the user to invoke a process that would sit in between the data source and the rendering engine.
The SLD style sheet is a neat place to do this as it allow for dynamic applications to be written that would just change the style on the fly to extract different views out of a given data set (for example, changing on the fly the contour levels to be extracted)
Now, most of the meaningful rendering transformation can also be considered as valuable stand alone processes. It makes sense to bridge the two worlds so that SLD can call onto a process via the above transformation.
This is achieved by a filter/process bridge, a FunctionFactory called ProcessFunctionFactory which looks for all processes that will return just one result and that generates function wrappers around them. In fact, a function is just a process that returns a single output, and vice versa, any process returning a single output can be seen as a function.
There is however a mismatch to be solved, function arguments are positional, process arguments are named instead. The mismatch has been solved by making the process function wrappers access parameters that are maps from a string (the argument name) to a value, and creating a function, called “parameter” that builds those maps.
The “parameter” function will assume the first argument is always the parameter name, whilst the value of the returned map will be:
- its context (the feature collection or the coverage) if the argument is just one (which is assumed to be the process parameter name)
- the second argument if there are only two
- a List collecting all of the arguments besides the first if there are more than two
This takes care of all the normal needs, that is, passing the source dataset to the process, passing a given single valued argument, or passing down a multivalued argument.
This allows to build a transformation in SLD that looks as follows:
.. code-block:: xml
- <FeatureTypeStyle>
- <Transformation>
- <ogc:Function name=”gs:Contour”>
- <ogc:Function name=”parameter”>
- <ogc:Literal>data</ogc:Literal>
</ogc:Function> <ogc:Function name=”parameter”>
<ogc:Literal>levels</ogc:Literal> <ogc:Literal>1100</ogc:Literal> <ogc:Literal>1200</ogc:Literal> <ogc:Literal>1300</ogc:Literal> <ogc:Literal>1400</ogc:Literal> <ogc:Literal>1500</ogc:Literal> <ogc:Literal>1600</ogc:Literal> <ogc:Literal>1700</ogc:Literal> <ogc:Literal>1800</ogc:Literal></ogc:Function>
</ogc:Function>
</Transformation> <Rule> ...
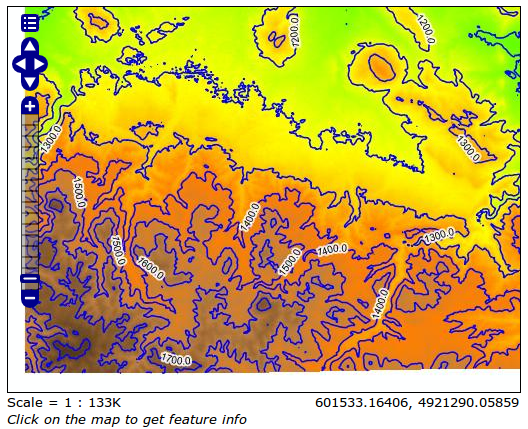
Contour extraction
In this case the transformation extracts contours out of a DEM at user specified levels and then paints them labeling them according to their elevation.
Go to the GeoServer Layer Preview and select the Layer
sf:demModify the WMS
GetMapURL by updating those two parameters as follows:- layers=sf:dem,sf:dem
- styles=,g_contour
The final URL should be
http://localhost:8083/geoserver/sf/wms?service=WMS&version=1.1.0&request=GetMap&layers=sf:sfdem,sf:sfdem&styles=,g_contour&bbox=589980.0,4913700.0,609000.0,4928010.0&width=512&height=385&srs=EPSG:26713&format=application/openlayers
Zomm in and out in order to see the on-the-fly generated contours for the DEM layer
The
g_contourstyle appear like this (it can be edited from the GeoServer Style page)
<?xml version="1.0" encoding="ISO-8859-1"?>
<StyledLayerDescriptor version="1.0.0"
 xsi:schemaLocation="http://www.opengis.net/sld StyledLayerDescriptor.xsd"
 xmlns="http://www.opengis.net/sld"
 xmlns:ogc="http://www.opengis.net/ogc"
 xmlns:xlink="http://www.w3.org/1999/xlink"
 xmlns:xsi="http://www.w3.org/2001/XMLSchema-instance">
  <!-- a Named Layer is the basic building block of an SLD document -->
  <NamedLayer>
    <Name>default_line</Name>
    <UserStyle>
    <!-- Styles can have names, titles and abstracts -->
      <Title>Default Line</Title>
      <Abstract>A sample style that draws a line</Abstract>
      <!-- FeatureTypeStyles describe how to render different features -->
      <!-- A FeatureTypeStyle for rendering lines -->
      <FeatureTypeStyle>
        <Transformation>
          <ogc:Function name="gs:Contour">
            <ogc:Function name="parameter">
              <ogc:Literal>data</ogc:Literal>
            </ogc:Function>
            <ogc:Function name="parameter">
              <ogc:Literal>levels</ogc:Literal>
              <ogc:Literal>1100</ogc:Literal>
              <ogc:Literal>1200</ogc:Literal>
              <ogc:Literal>1300</ogc:Literal>
              <ogc:Literal>1400</ogc:Literal>
              <ogc:Literal>1500</ogc:Literal>
              <ogc:Literal>1600</ogc:Literal>
              <ogc:Literal>1700</ogc:Literal>
              <ogc:Literal>1800</ogc:Literal>
            </ogc:Function>
          </ogc:Function>
        </Transformation>

        <Rule>
          <Name>rule1</Name>
          <Title>Blue Line</Title>
          <Abstract>A solid blue line with a 1 pixel width</Abstract>
          <LineSymbolizer>
            <Stroke>
              <CssParameter name="stroke">#0000FF</CssParameter>
            </Stroke>
          </LineSymbolizer>
          <TextSymbolizer>
          <Label>
            <ogc:PropertyName>value</ogc:PropertyName>
          </Label>

          <Font>
            <CssParameter name="font-family">Arial</CssParameter>
            <CssParameter name="font-style">Normal</CssParameter>
            <CssParameter name="font-size">10</CssParameter>
          </Font>

          <LabelPlacement>
            <LinePlacement>
            </LinePlacement>
          </LabelPlacement>
          <Halo>
            <Radius>
              <ogc:Literal>2</ogc:Literal>
            </Radius>
            <Fill>
              <CssParameter name="fill">#FFFFFF</CssParameter>
              <CssParameter name="fill-opacity">0.85</CssParameter>
            </Fill>
          </Halo>

          <Fill>
            <CssParameter name="fill">#000000</CssParameter>
          </Fill>

          <VendorOption name="followLine">true</VendorOption>
          <VendorOption name="repeat">200</VendorOption>
          <VendorOption name="maxDisplacement">50</VendorOption>
          <VendorOption name="maxAngleDelta">30</VendorOption>
        </TextSymbolizer>
        </Rule>
      </FeatureTypeStyle>
    </UserStyle>
  </NamedLayer>
</StyledLayerDescriptor>
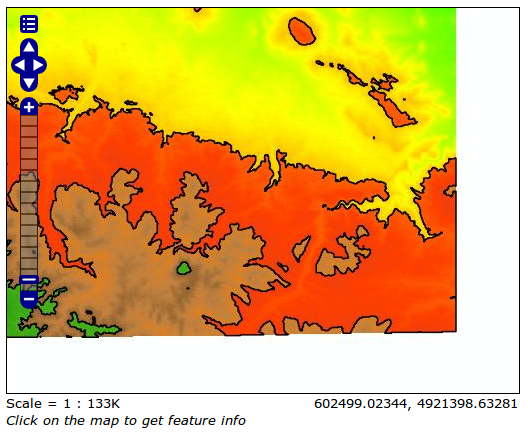
Contour extraction styled as Polygons
In this case the transformation extracts contours out of a DEM at user specified levels and then paints them as polygons according to their elevation.
Go to the GeoServer Layer Preview and select the Layer
sf:demModify the WMS
GetMapURL by updating those two parameters as follows:- layers=sf:dem,sf:dem
- styles=,g_polygons
The final URL should be
http://localhost:8083/geoserver/sf/wms?service=WMS&version=1.1.0&request=GetMap&layers=sf:sfdem,sf:sfdem&styles=,g_polygons&bbox=589980.0,4913700.0,609000.0,4928010.0&width=512&height=385&srs=EPSG:26713&format=application/openlayers
Zomm in and out in order to see the on-the-fly generated contours for the DEM layer
The
g_polygonsstyle appear like this (it can be edited from the GeoServer Style page)
<?xml version="1.0" encoding="ISO-8859-1"?>
<StyledLayerDescriptor version="1.0.0"
 xsi:schemaLocation="http://www.opengis.net/sld StyledLayerDescriptor.xsd"
 xmlns="http://www.opengis.net/sld"
 xmlns:ogc="http://www.opengis.net/ogc"
 xmlns:xlink="http://www.w3.org/1999/xlink"
 xmlns:xsi="http://www.w3.org/2001/XMLSchema-instance">
  <!-- a Named Layer is the basic building block of an SLD document -->
  <NamedLayer>
    <Name>default_line</Name>
    <UserStyle>
    <!-- Styles can have names, titles and abstracts -->
      <Title>Default Line</Title>
      <Abstract>A sample style that draws a line</Abstract>
      <!-- FeatureTypeStyles describe how to render different features -->
      <!-- A FeatureTypeStyle for rendering lines -->
      <FeatureTypeStyle>
        <Transformation>
          <ogc:Function name="gs:PolygonExtraction">
            <ogc:Function name="parameter">
              <ogc:Literal>data</ogc:Literal>
            </ogc:Function>
            <ogc:Function name="parameter">
              <ogc:Literal>ranges</ogc:Literal>
              <ogc:Literal>[1300;1500]</ogc:Literal>
              <ogc:Literal>(1700;1900]</ogc:Literal>
            </ogc:Function>
          </ogc:Function>
        </Transformation>
        <Rule>
          <Name>range1</Name>
          <Title>First range</Title>
          <ogc:Filter>
             <ogc:PropertyIsEqualTo>
                <ogc:PropertyName>value</ogc:PropertyName>
                <ogc:Literal>1</ogc:Literal>
             </ogc:PropertyIsEqualTo>
          </ogc:Filter>
          <PolygonSymbolizer>
             <Fill>
                <CssParameter name="fill">#FF0000</CssParameter>
                <CssParameter name="fill-opacity">0.5</CssParameter>
             </Fill>
            <Stroke/>
          </PolygonSymbolizer>
        </Rule>
        <Rule>
          <Name>range2</Name>
          <Title>Second range</Title>
          <ogc:Filter>
             <ogc:PropertyIsEqualTo>
                <ogc:PropertyName>value</ogc:PropertyName>
                <ogc:Literal>2</ogc:Literal>
             </ogc:PropertyIsEqualTo>
          </ogc:Filter>
          <PolygonSymbolizer>
             <Fill>
                <CssParameter name="fill">#00FF00</CssParameter>
                <CssParameter name="fill-opacity">0.5</CssParameter>
             </Fill>
            <Stroke/>
          </PolygonSymbolizer>
        </Rule>

      </FeatureTypeStyle>
    </UserStyle>
  </NamedLayer>
</StyledLayerDescriptor>
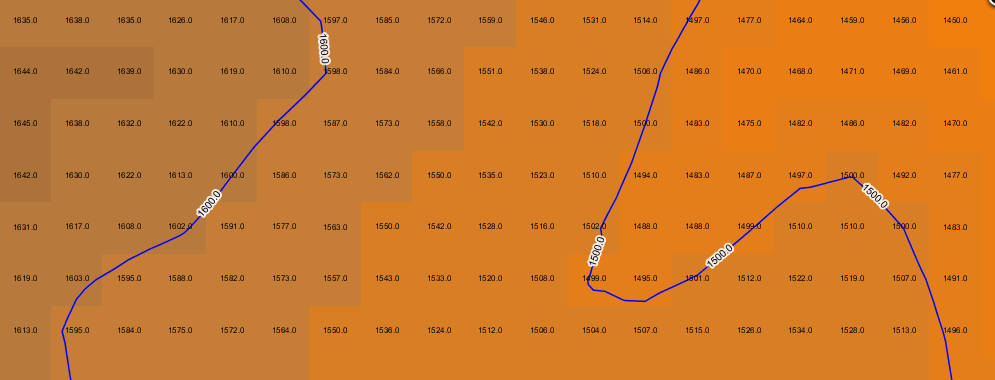
Point extraction
In this case the transformation extracts points out of a DEM at user specified levels. The points will be visible only at higher zoom levels due to the scale-denominator.
Go to the GeoServer Layer Preview and select the Layer
sf:demModify the WMS
GetMapURL by updating those two parameters as follows:- layers=sf:dem,sf:dem,sf:dem
- styles=,g_point,g_contour
The final URL should be
http://localhost:8083/geoserver/sf/wms?service=WMS&version=1.1.0&request=GetMap&layers=sf:sfdem,sf:sfdem,sf:sfdem&styles=,g_point,g_contour&bbox=589980.0,4913700.0,609000.0,4928010.0&width=512&height=385&srs=EPSG:26713&format=application/openlayers
Zomm in until the points labels appear in order to see the on-the-fly generated contours and points for the DEM layer
The
g_pointstyle appear like this (it can be edited from the GeoServer Style page)
<?xml version="1.0" encoding="ISO-8859-1"?>
<StyledLayerDescriptor version="1.0.0"
  xsi:schemaLocation="http://www.opengis.net/sld StyledLayerDescriptor.xsd"
  xmlns="http://www.opengis.net/sld" xmlns:ogc="http://www.opengis.net/ogc"
  xmlns:xlink="http://www.w3.org/1999/xlink" xmlns:xsi="http://www.w3.org/2001/XMLSchema-instance">
  <NamedLayer>
    <Name>default_line</Name>
    <UserStyle>
      <Title>Default Line</Title>
      <Abstract>A sample style that draws a line</Abstract>
      <FeatureTypeStyle>
        <Transformation>
          <ogc:Function name="gs:RasterAsPointCollection">
            <ogc:Function name="parameter">
              <ogc:Literal>data</ogc:Literal>
            </ogc:Function>
          </ogc:Function>
        </Transformation>
        <Rule>
          <maxScaleDenominator>2100</maxScaleDenominator>
          <TextSymbolizer>
            <Label>
              <ogc:PropertyName>GRAY_INDEX</ogc:PropertyName>
            </Label>
            <Font>
              <CssParameter name="font-family">Arial</CssParameter>
              <CssParameter name="font-style">Normal</CssParameter>
              <CssParameter name="font-size">8</CssParameter>
            </Font>
            <Fill>
              <CssParameter name="fill">#000000</CssParameter>
            </Fill>
          </TextSymbolizer>
        </Rule>
      </FeatureTypeStyle>
    </UserStyle>
  </NamedLayer>
</StyledLayerDescriptor>
Wind arrows
The Process gs:RasterAsPointCollection can be used also for dynamically drawing wind arrows for instance.
In this case we have a raster layer with two float64 bands containing the u and v components or a wind vector. The style first extracts the pixel centers as a list of points whose attributes are u and v, then composes them to generate magnitude and direction of the wind arrow, finally it activates conflict resolution so that no two arrows overlap with each other.
Go to the GeoServer Layer Preview and select the Layer
it.geosolutions:windClick on the
Toggle Options Toolbarbutton on the map, and try to change the styles fromg_arrowstog_arrows2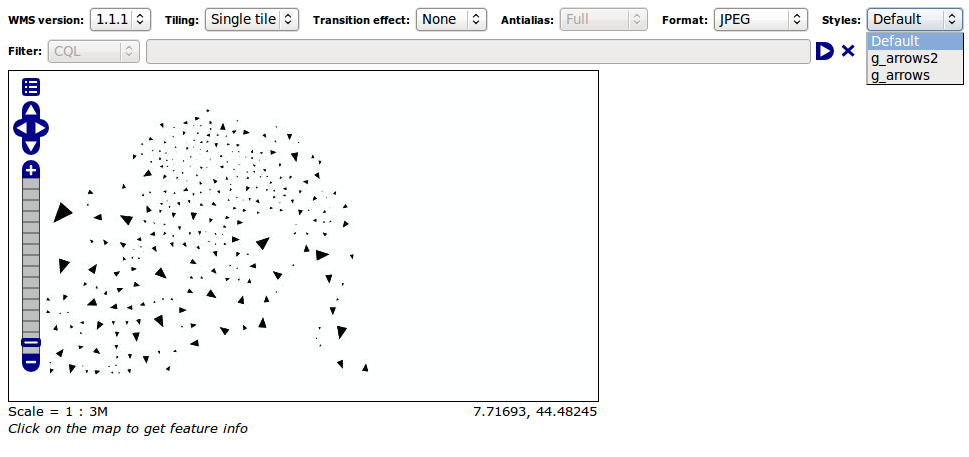
Note
The styles
g_arrowsandg_arrows2, compute magnitude and direction of the arrow on the fly by using filter functions.The
g_arrowsstyle, enabling conflict resolutions, appear like below (it can be edited from the GeoServer Style page).. code-block:: xml <StyledLayerDescriptor version="1.0.0" xmlns="http://www.opengis.net/sld" xmlns:gml="http://www.opengis.net/gml" xmlns:ogc="http://www.opengis.net/ogc" xmlns:xlink="http://www.w3.org/1999/xlink" xmlns:xsi="http://www.w3.org/2001/XMLSchema-instance" xsi:schemaLocation="http://www.opengis.net/sld ./StyledLayerDescriptor.xsd"> <NamedLayer> <Name>contour_lines</Name> <UserStyle> <FeatureTypeStyle> <Transformation> <ogc:Function name="gs:RasterAsPointCollection"> <ogc:Function name="parameter"> <ogc:Literal>data</ogc:Literal> </ogc:Function> </ogc:Function> </Transformation> <Rule> <TextSymbolizer> <Label><![CDATA[ ]]></Label> <!-- fake label --> <Graphic> <Mark> <WellKnownName>shape://carrow</WellKnownName> <Fill> <CssParameter name="fill">#000000</CssParameter> </Fill> </Mark> <Size> <ogc:Mul> <ogc:Function name="sqrt"> <ogc:Add> <ogc:Mul> <ogc:PropertyName>Band1</ogc:PropertyName> <ogc:PropertyName>Band1</ogc:PropertyName> </ogc:Mul> <ogc:Mul> <ogc:PropertyName>Band2</ogc:PropertyName> <ogc:PropertyName>Band2</ogc:PropertyName> </ogc:Mul> </ogc:Add> </ogc:Function> <ogc:Literal>200</ogc:Literal> </ogc:Mul> </Size> <Rotation> <ogc:Function name="toDegrees"> <ogc:Function name="atan2"> <ogc:PropertyName>Band2</ogc:PropertyName> <ogc:PropertyName>Band1</ogc:PropertyName> </ogc:Function> </ogc:Function> </Rotation> </Graphic> <Priority> <ogc:Add> <ogc:Mul> <ogc:PropertyName>Band1</ogc:PropertyName> <ogc:PropertyName>Band1</ogc:PropertyName> </ogc:Mul> <ogc:Mul> <ogc:PropertyName>Band2</ogc:PropertyName> <ogc:PropertyName>Band2</ogc:PropertyName> </ogc:Mul> </ogc:Add> </Priority> </TextSymbolizer> </Rule> </FeatureTypeStyle> </UserStyle> </NamedLayer> </StyledLayerDescriptor>The
g_arrows2style, disabling conflict resolutions, appear like below (it can be edited from the GeoServer Style page)
<StyledLayerDescriptor version="1.0.0"
     xmlns="http://www.opengis.net/sld" xmlns:gml="http://www.opengis.net/gml"
     xmlns:ogc="http://www.opengis.net/ogc" xmlns:xlink="http://www.w3.org/1999/xlink"
     xmlns:xsi="http://www.w3.org/2001/XMLSchema-instance"
     xsi:schemaLocation="http://www.opengis.net/sld ./StyledLayerDescriptor.xsd">
     <NamedLayer>
       <Name>contour_lines</Name>
       <UserStyle>
         <FeatureTypeStyle>
           <Transformation>
             <ogc:Function name="gs:RasterAsPointCollection">
               <ogc:Function name="parameter">
                 <ogc:Literal>data</ogc:Literal>
               </ogc:Function>
             </ogc:Function>
           </Transformation>
           <Rule>
             <TextSymbolizer>
               <Label><![CDATA[ ]]></Label> <!-- fake label -->
               <Graphic>
                 <Mark>
                   <WellKnownName>shape://carrow</WellKnownName>
                   <Fill>
                     <CssParameter name="fill">#000000</CssParameter>
                   </Fill>
                 </Mark>
                 <Size>
                   <ogc:Mul>
                   <ogc:Function name="sqrt">
                     <ogc:Add>
                       <ogc:Mul>
                         <ogc:PropertyName>Band1</ogc:PropertyName>
                         <ogc:PropertyName>Band1</ogc:PropertyName>
                       </ogc:Mul>
                       <ogc:Mul>
                         <ogc:PropertyName>Band2</ogc:PropertyName>
                         <ogc:PropertyName>Band2</ogc:PropertyName>
                       </ogc:Mul>
                     </ogc:Add>
                   </ogc:Function>
                   <ogc:Literal>200</ogc:Literal>
                   </ogc:Mul>
                 </Size>
                 <Rotation>
                    <ogc:Function name="toDegrees">
                      <ogc:Function name="atan2">
                           <ogc:PropertyName>Band2</ogc:PropertyName>
                           <ogc:PropertyName>Band1</ogc:PropertyName>
                      </ogc:Function>
                   </ogc:Function>
                 </Rotation>
               </Graphic>
               <Priority>
                 <ogc:Add>
                   <ogc:Mul>
                     <ogc:PropertyName>Band1</ogc:PropertyName>
                     <ogc:PropertyName>Band1</ogc:PropertyName>
                   </ogc:Mul>
                   <ogc:Mul>
                     <ogc:PropertyName>Band2</ogc:PropertyName>
                     <ogc:PropertyName>Band2</ogc:PropertyName>
                   </ogc:Mul>
                 </ogc:Add>
               </Priority>
               <VendorOption name="conflictResolution">false</VendorOption>
             </TextSymbolizer>
           </Rule>
         </FeatureTypeStyle>
       </UserStyle>
     </NamedLayer>
   </StyledLayerDescriptor>